| Logging Tool Tour | Options Menu | Help Menu |
Reports Menu
Features

Fig. Reports-Menu-1: The Reports Menu.
| Activity Step Reports... | Creates graphs and spreadsheets which show the progress of case study members in activity steps chosen by the logging curator. The case study members which are considered for the reports represent a filtered list. By default case study members are included in the reports if they have a date value for a selected activity step. Users can filter subjects based on some demographic field, whether an activity step field has a value which lies between two dates, or a combination of these two filters. |
Tasks
Create a progress report
- Click on the "Reports Menu".
-
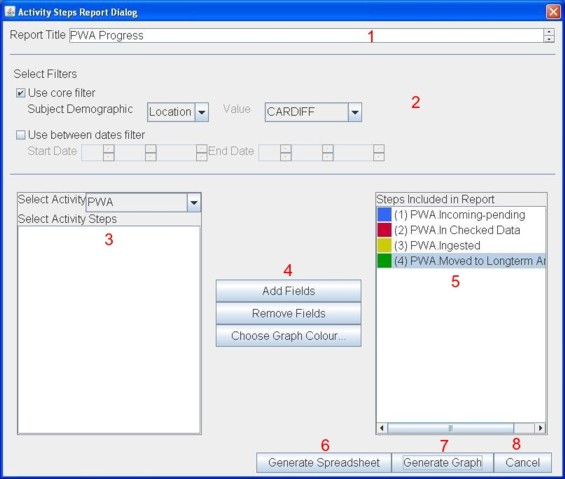
Click on "Activity Step Reports...". You should see the dialog below

Fig. Reports-Menu-2: The Activity step report viewer.
- Choose a title for the report. This will be printed on the progress charts.
- The viewer lets you select what activity steps you want to include in your report. However, you should first specify the kinds of subjects you want to examine. By default, subjects will be included in the report if they have a date value filled for a selected activity step.
- You can use other filters to describe the subjects to include in the report. If you tick the "Use demographic filter", you can activate the filter which matches records based on whether they have a specified value for a demographic field.
- You can also specify a date interval that subject records must match for selected activity steps.
- You can use one or both of these filters in combination.
- Choose the activity steps for your report by selecting activity steps in the list on the left part of the screen. Use the "Add Fields" and the "Remove Fields" buttons to decide on a final list of activity steps; these steps will appear in the list on the right part of the screen.
- You can determine the chart colour used to represent a selected activity step. Choose an item in the right-hand list and then click "Choose Graph Colour". You should then be presented with a colour selection dialog. Alternatively you can double click on a selected activity step to see the same dialog.
-
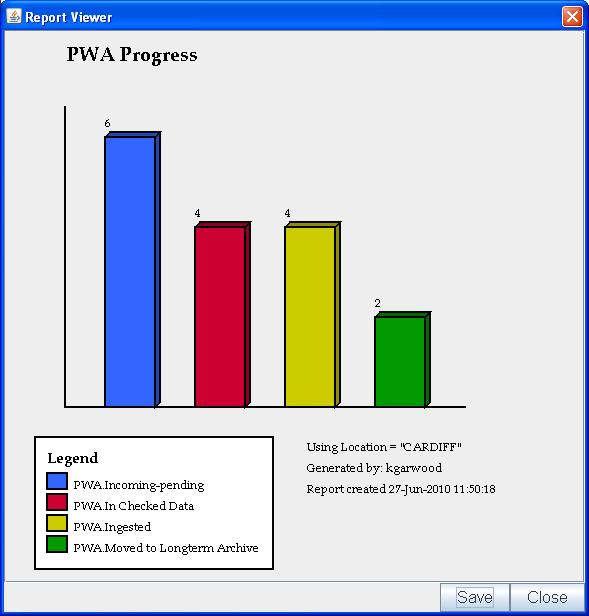
You can create two types of reports. First, click "Generate Graph". You should see
the dialog below.

Fig. Reports-Menu-3: The report viewer.
-
If you want you can save the chart as a
JPGfile. -
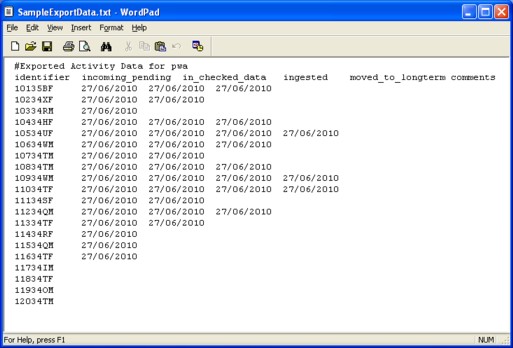
In the Activity Steps Report Dialog, you can also press "Generate spreadsheet...".
This option allows you to export a report showing all the subjects who matched the
conditions of at least one activity step. For each subject, the date field value is
printed for each of the activity steps you've chosen. A sample export file may
resemble the following file:

Fig. Reports-Menu-4: A sample progress report expressed as a spreadsheet.
Author: Sheila Raynor
(c)2010 Medical Research Council. Licensed under Apache 2.0.
